PACIFIC CONSULTANTS' KENKO Investment for Health (KIH)
PACIFIC CONSULTANTS believes that the physical, mental and social well-being of employees is the most important foundation of management in order to realize our group vision of "Producing the Future," and so we hereby declare that we will promote KENKO Investment for Health (KIH).
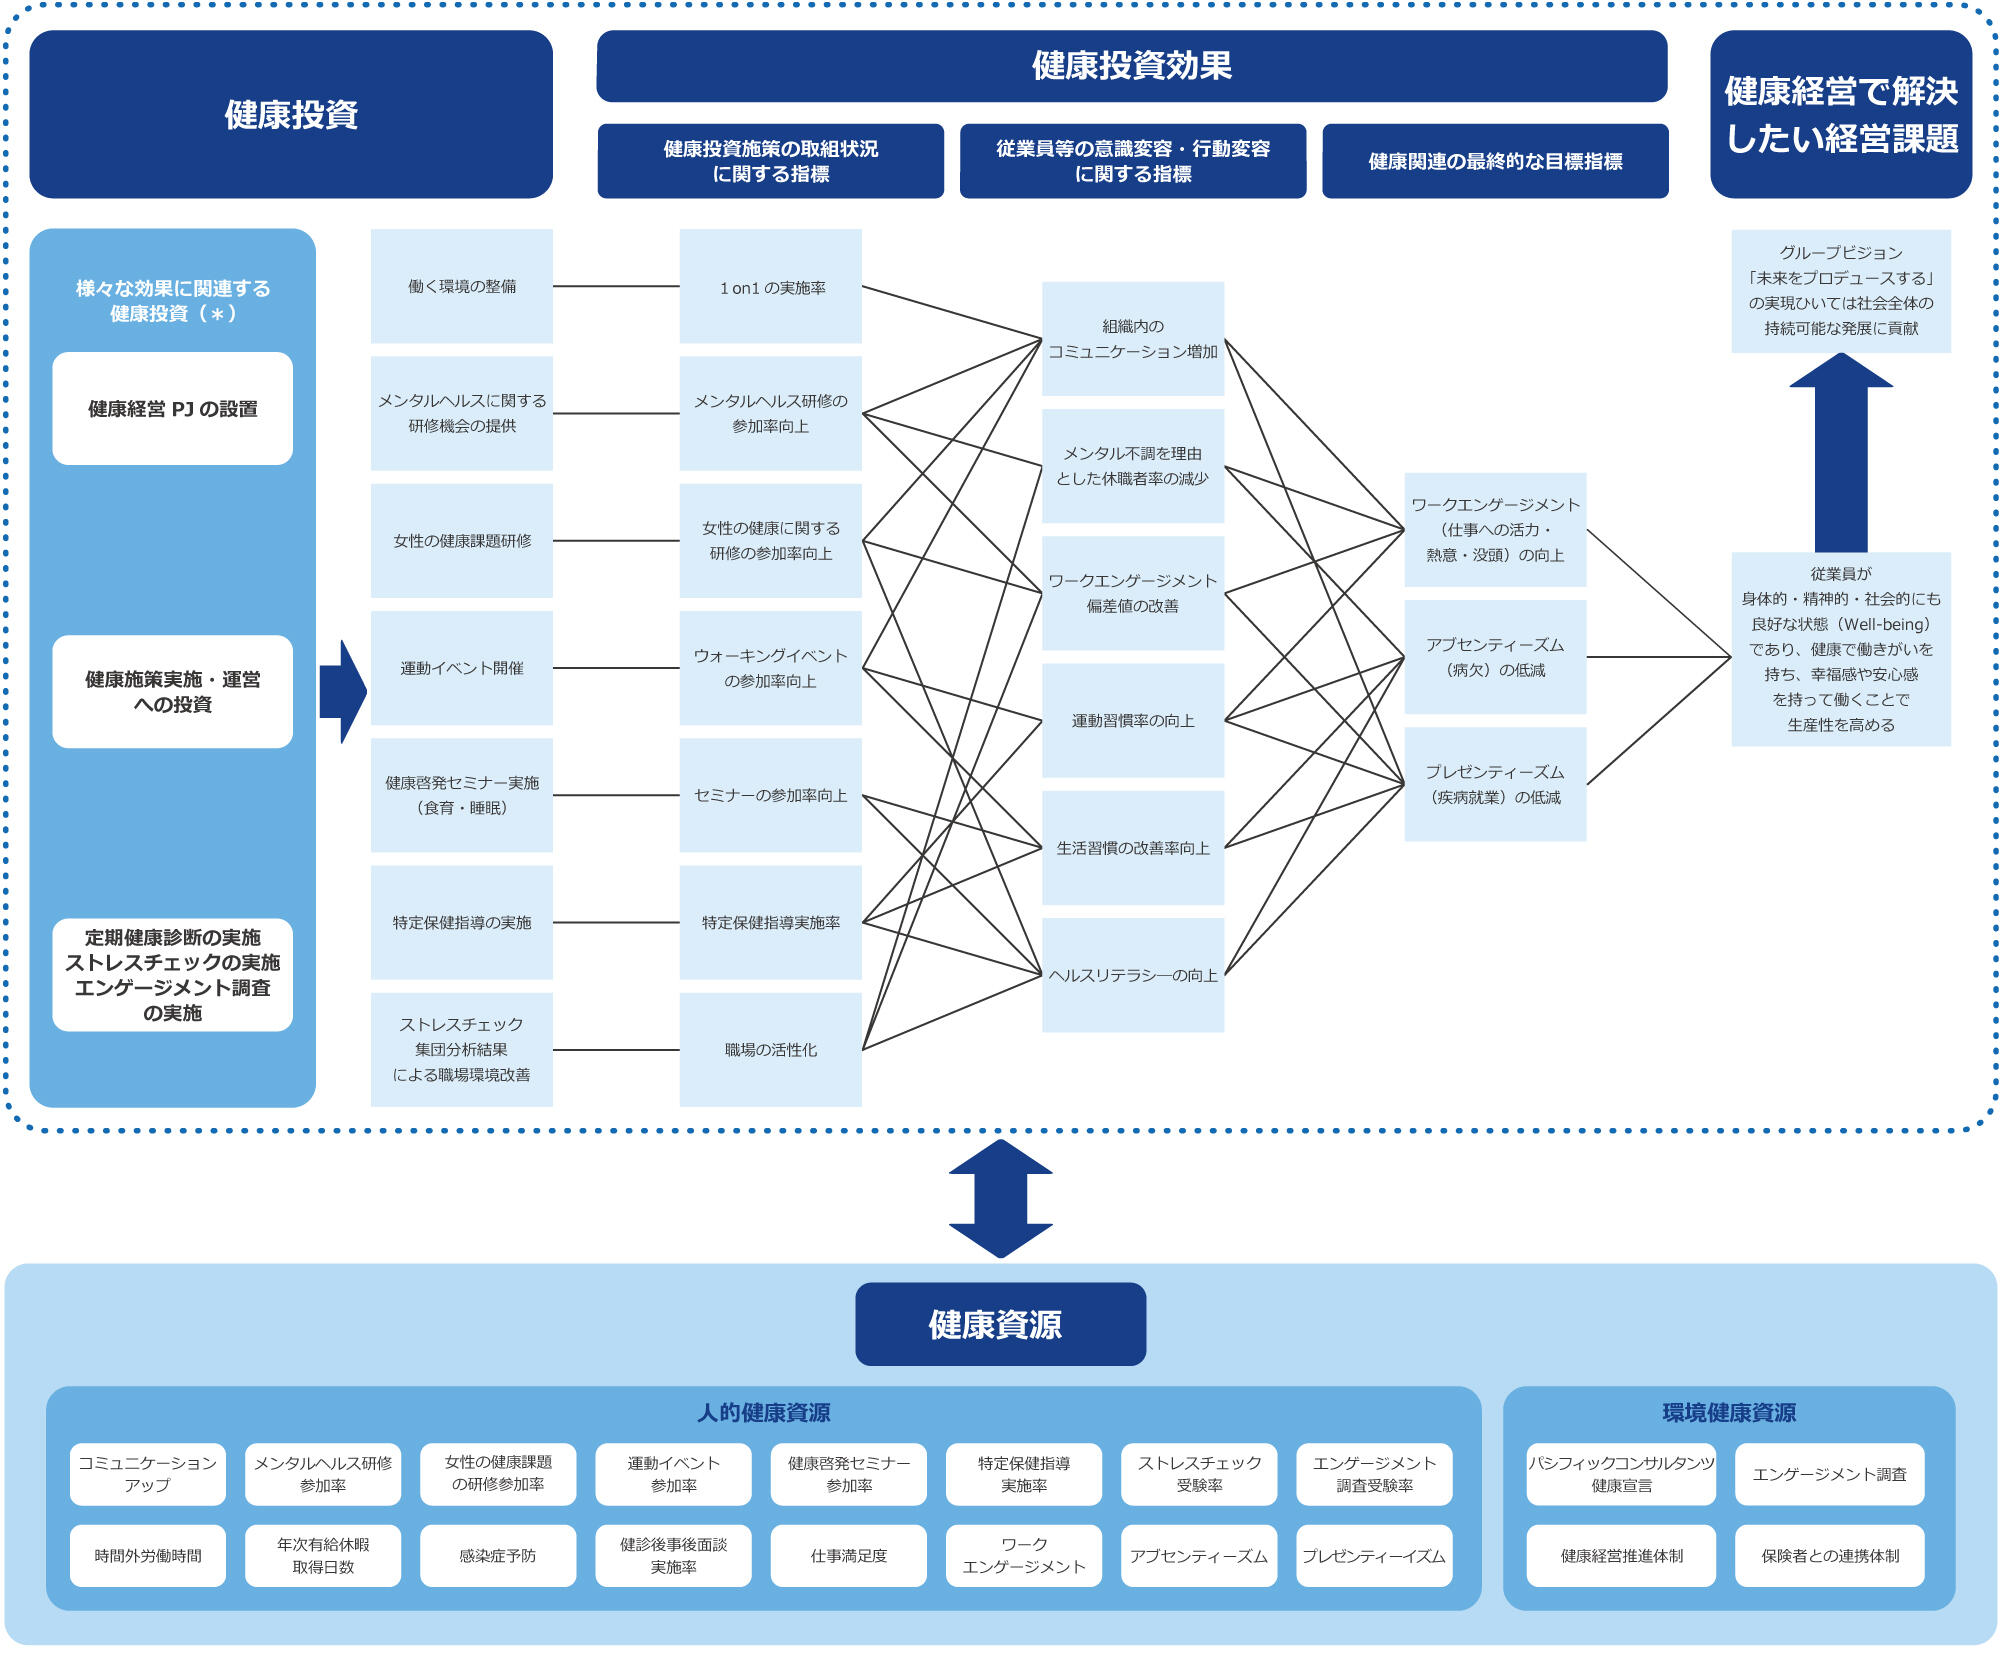
We will implement various measures to create a working environment where each employee can work to maintain and improve their health. By having employees who are healthy and motivated to work, and who can work with a sense of happiness and security, we will be able to increase productivity and contribute to the realization of our group vision and the sustainable development of society as a whole.
PACIFIC CONSULTANTS CO., LTD.
Representative Director, President Executive Officer,
Osamu OMOTO
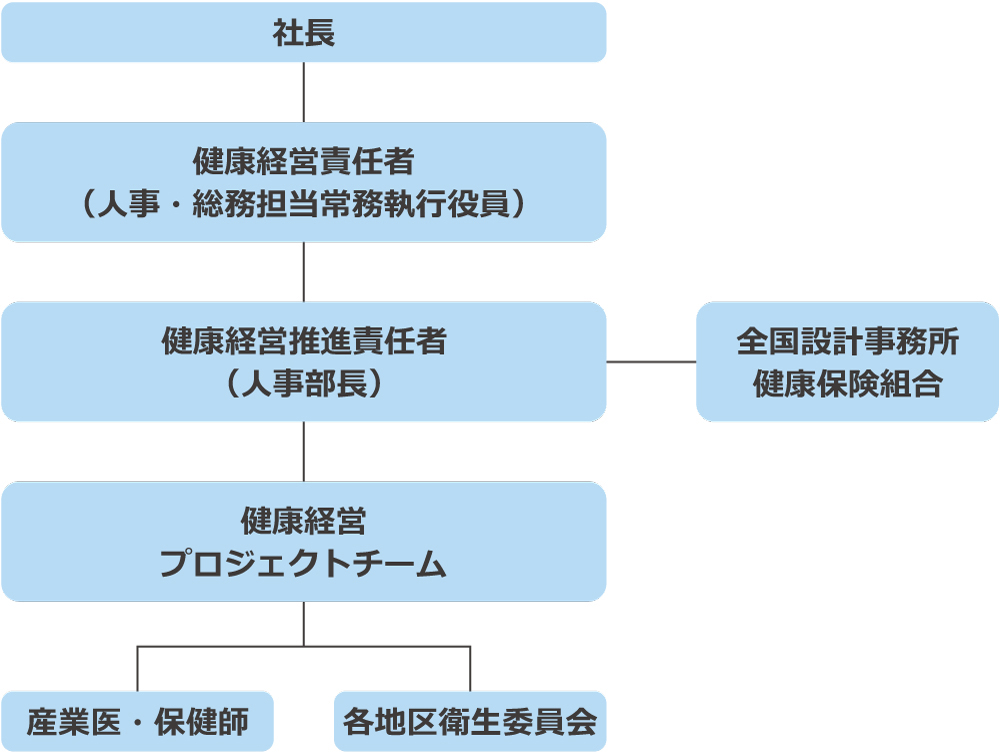
KENKO Investment for Health (KIH) Promotion System
With President at the helm, the KIH Promotion Officer (General Manager of Human Resurceds) will implement various KIH measures under the direction of the KIH Top Manager (Managing Executive Manager in charge of Human Resources and General Affairs). The KIH Project Team, which was established across Corporate Group, will share information with the Health Insurance Society of Architectural Office, industrial physician and public health nurse, and each Area Health Committee, consider health measures, and lead company-wide activities.
Health Issues
We have a full-time industrial physician and public health nurse on-site, and we implement many health measures, such as individual interviews with all employees by public health nurse and support for balancing work and illness. However, there may be invisible health issues, such as feeling unwell due to stress.
As a result of analyzing regular health checkups up to fiscal year 2022, we found that our blood sugar risk is higher than other companies, and that our lipid risk and lack of exercise risk values are similar to other companies. Therefore, we are taking the following health measures.
- Absenteeism, Presenteeism, and Work Engagement Survey
- Improving mental health care
- Holding athletic events
- Implementing health awareness seminars
- Improving the rate of specific health guidance
Disclosure of Health Index
| Index | FY71st (FY2022) |
FY72nd (FY2023) |
FY73rd (FY2024) |
FY74th (FY2025) |
|---|---|---|---|---|
| Regular health check-up attendance rate | 99.9% | 99.3% | 100.0% | 100.0% |
| Detailed examination attendance rate | - | - | 75.0% | -※6 |
| Stress check participation rate | 96.1% | 94.0% | 96.1% | 98.9% |
| High stress rate | 3.8% | 4.2% | 3.8% | 3.6% |
| Participation rate of measures establishing exercise habits | - | 15.7% | 8.2% | 21.2% |
| Participation rate of measures improving dietary habits | - | 3.0% | 4.7% | 2.0% |
| Implementation rate of health guidance provided to high-risk individuals | 95.7% | 92.3% | 94.5% | 94.4% |
| Participation in measures related to women's health issues | - | 14.5%※1 | 100.0% | 100.0% |
| Employee satisfaction with each measure *2 | - | - | 82.4% | 95.4% |
| Smoking rate | 17.4% | 16.6% | 17.9% | 14.7% |
| Rate of people with exercise habits | 24.7% | 24.9% | 25.3% | 21.2% |
| Ideal weight rate | 65.4% | 65.7% | 60.9% | 64.5% |
| Rate of patients with abnormal findings | 42.7% | 39.5% | 40.2% | 42.2% |
| Number of work-related accidents (excluding commuting accidents) | 10 cases | 0 cases | 4 cases | 6 items |
| Frequency rate of work-related accidents (excluding commuting accidents) | 0.39 | 0 | 0 | 0 |
| Severity rate of work-related accidents (excluding commuting accidents) | 0.02 | 0 | 0 | 0 |
| Absenteeism *3 | - | 2.0 days | 2.8 days | 2.2 days |
| Presenteeism *4 | - | 20.4% | 20.6% | 22.0% |
| Work engagement *5 | - | 3.5 points | 3.5 points | 3.4 points |
*1 Percentage of line managers
*2 The average percentage of respondents who answered "satisfied" or "somewhat satisfied" with each measure in the post-measure survey.
*3 Measurement method: Average number of days of absence, sick leave, or leave of absence used by all employees. (Paid leave is not included), [Number of people and percentage measured in FY2025] 6,498 days ÷ 2,986 people
*4 Measurement method: Average of all employees using SPQ (University of Tokyo 1-item version). [Number of people measured and valid response rate for FY2025] 2,972 people / 3,378 people, 88.0%
*5 Measurement method: Average of all employees using the shortened version of the Utrecht Work Engagement Scale (3 items: vitality, enthusiasm, and engagement) (7-point scale from 0: strongly disagree to 6: strongly agree). [Number of respondents and valid response rate for FY2025] 3,229 out of 3,378, 95.6%
*6 Counting in progress