ESG Data Pickup
Environment
| Classification | Index | U | 2022 (FY71) |
2023 (FY72) |
2024 (FY73) |
2025 (FY74) |
|---|---|---|---|---|---|---|
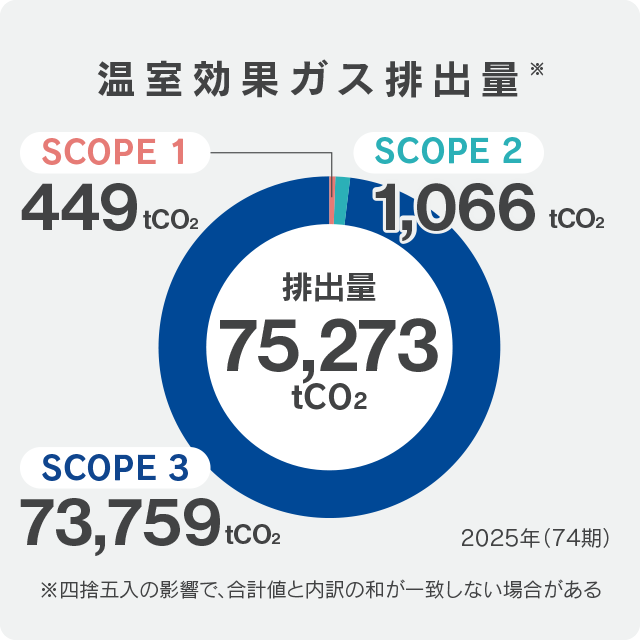
| Greenhouse Gas Emissions | tCO2 | 48,111 | 61,222 | 65,224 | 75,273 | |
| SCOPE1 | tCO2 | 798 | 586 | 545 | 449 | |
| SCOPE2 | tCO2 | 2,000 | 2,032 | 1,835 | 1,066 | |
| SCOPE3 | tCO2 | 45,313 | 58,604 | 62,845 | 73,759 | |
| Power Consumption Amount | 1,000 kWh | 4,620 | 4,834 | 4,721 | 4,743 | |
| Of which, Renewable Energy Power Amount | 1,000 kWh | 73 | 280 | 623 | 2,700 | |
Governance
| Classification | Index | U | 2022 (FY71) |
2023 (FY72) |
2024 (FY73) |
2025 (FY74) |
|---|---|---|---|---|---|---|
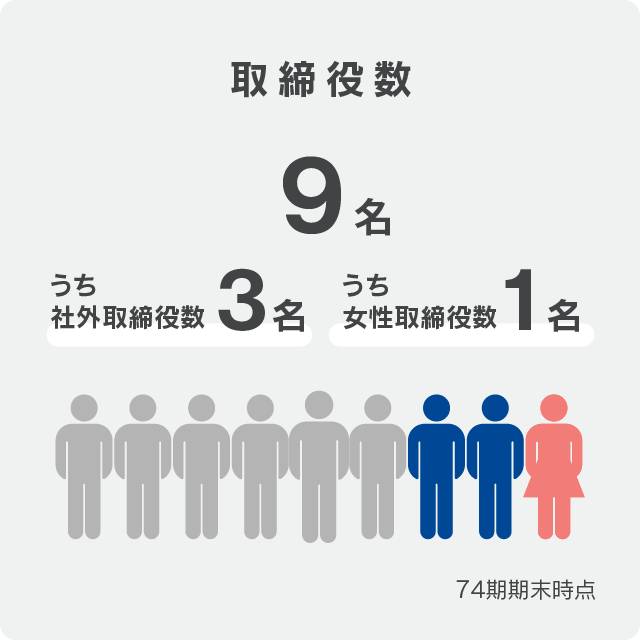
| Board Members | Number of Director/Board Member | Per. | 13 | 10 | 9 | 9 |
| Number of Outside Director | Per. | 3 | 3 | 3 | 3 | |
| Male | Per. | 11 | 9 | 8 | 8 | |
| Female | Per. | 2 | 1 | 1 | 1 | |
| Number of Executive Officer | Per. | - | - | - | 10 | |
| Male | Per. | - | - | - | 9 | |
| Female | Per. | - | - | - | 1 | |
| Number of Senior Executive Officer | Per. | 3 | 6 | 5 | 8 | |
| Male | Per. | 3 | 6 | 5 | 8 | |
| Female | Per. | 0 | 0 | 0 | 0 | |
| Number of Executive Officer | Per. | 16 | 11 | 10 | 5 | |
| Male | Per. | 16 | 10 | 9 | 5 | |
| Female | Per. | 0 | 1 | 1 | 0 | |
| Rewards | Director/Board Member Remuneration (Total Amount) | Mil. yen | 297 | 247 | 242 | 272 |
Social
(FY71)
(FY72)
(FY73)
(FY74)