Analyzing trade areas and regional characteristics is essential for corporate marketing and for planning services and urban development measures promoted by local governments. Various types of big data are now available, and their utilization is attracting attention, but many people are unsure of the effects they can expect. We spoke to Taichi FUDAMOTO of the DX Business Promotion Dept., Digital Service Div. and one of the core members developing the human flow statistics service "Nation-wide Movement Statistics," about what area marketing using big data is, what it can reveal, and how it can be utilized.
INDEX
- What is area marketing?
- Key points for implementing area marketing
- Area marketing methods and features
- What you can learn from the "Nation-wide Movement Statistics
- What PACIFIC CONSULTANTS can do
What is Area Marketing?
Area marketing is the study of business operations based on an analysis of the characteristics of a region or trade area in order to maximize profits and effects. By identifying the characteristics of the region or trade area, businesses can launch services and products that meet needs, consider and implement promotional content and methods, and expand their business. Analysis of regional characteristics is also essential when considering policies implemented by local governments. Detailed research and analysis of the region is a prerequisite for policy planning, such as determining what kind of resident services are needed and how to promote regional development and urban development.
As competition between companies intensifies against the backdrop of a declining population, and government policies face increasing financial and human constraints, analyzing trade areas and regions is becoming increasingly important in order to ensure that what is needed is provided.
Key points for implementing area marketing
Traditional analyses of trade areas and regional characteristics are based on statistical surveys such as the national census, household surveys, and housing and land statistics surveys, and are based on determining how many people live within a certain radius of a facility, and what their annual income is. Even if more in-depth analysis is undertaken, the problem remains that it is limited to determining the number of students, the number of elderly households, and the difference between daytime and nighttime populations.
However, this approach does not provide a clear picture of the true nature of a trade area or region. For example, even if a region is home to many high-income households, it may be that most of the shopping is done online. In another region, many people may prefer to buy heavy items like water or rice at a large supermarket a short drive away on weekends, rather than at a store within walking distance. Furthermore, some people choose to use a neighboring station rather than the nearest one because they want to commute seated or take the express train for a faster commute. Thus, for example, the "area around a station where you are considering opening a store" does not directly overlap with the trade area. People may have behaved the same way 20 years ago. However, today, various services, including e-commerce, are provided digitally, transportation options are diverse, and behavior varies depending on individuals' IT literacy and decision-making criteria. Furthermore, some people also place importance on "time performance," so income and behavior are not necessarily directly linked. Therefore, we believe that the traditional static analysis of "how many people with a certain annual income are in this area" does not provide a clear picture of the true nature of an area.
The same can be said about inbound tourism, which is expected to be the key to revitalizing local regions. In tourist destinations bustling with inbound tourists, people may try to stock up on a variety of souvenirs, but it is thought that few people will buy souvenirs that will become a burden on the first day of their trip or along the way. This is mainly towards the end of the day or at the airport. In fact, there are quite a few travelers who stock up on large suitcases along with lots of souvenirs at discount shops at or near the airport before heading home. What area marketing must now look at is people's movements themselves, such as lifestyles and travel itineraries.
Area marketing methods and features
Various types of human flow big data have emerged with the aim of understanding people flow for more precise area marketing. The most well-known type is based on big data collected using the GPS location information function on smartphones, but there are other methods for obtaining human flow data such as tables.
| How to Obtain | Base Station | GPS | Wi-Fi | Beacon | Sensing |
|---|---|---|---|---|---|
| Subject | A mobile phone that is turned on | GPS ON Smartphone |
Wi-Fi connected Smartphone |
While the target app is running Smartphone |
Sensing equipment Passing objects |
| How to obtain Data |
Communication history with base stations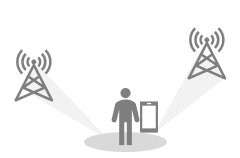 |
Satellite positioning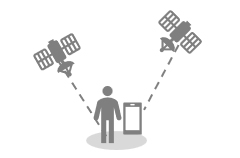 |
Wi-Fi connection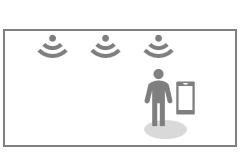 |
Beacons installed in stores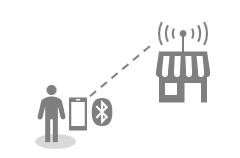 |
Camera images and laser |
| Coverage | ◎ Capable of understanding the flow of people across the country |
〇 Data acquisition in underground and indoors is difficult |
△ Wi-Fi access points within range |
△ Beacon installed stores |
△ Camera and laser within range |
| Spatial granularity | △ Dozens to hundreds of meters |
〇 In units of several meters |
〇 Access point unit (several meters) |
〇 In units of several meters |
◎ Capture people directly |
| Number of Samples | ◎ Based on the number of devices of each carrier |
〇 Data acquisition only when GPS is enabled |
△ Data acquisition only when connected to Wi-Fi |
△ Data acquisition only while the app is running |
〇 Within range, almost all items can be counted |
| Retrieving attributes | 〇 Based on terminal subscriber information, etc. |
△ Optional user registration |
△ Optional user registration |
△ Optional user registration |
△ Identification by AI facial recognition, etc. |
Created by PACIFIC CONSULTANTS. (Specifications and performance may vary depending on the individual service.)
While there are various methods for acquiring data, utilizing human flow big data from base stations is often beneficial because it allows for the acquisition of large samples in a specific area, such as a trade zone or region, makes it easy to understand OD (Origin - Destination), and provides more accurate attribute information. While GPS is useful for accurately capturing walking routes, data may not be collected when the app is not running, leading to significant daily fluctuations that can affect trade area analysis. However, base stations can be used in most locations as long as they are powered on, and movement is captured every time a base station changes, allowing for a continuous understanding of people's movements. Furthermore, base station data is based on device subscriber information, allowing for more accurate understanding of attributes.
What you can learn from the "Nation-wide Movement Statistics"
The people flow statistics data that utilizes this base station data is called "National Movement Statistics." It was jointly developed by the two companies, utilizing SoftBank's base station location information (big data) and PACIFIC CONSULTANTS' traffic engineering and location information analysis know-how, and won the Outstanding Technology Award at the 2021 Construction Xross (C-Xross) Kanto.
There are two reasons why "Nation-wide Movement Statistics" is attracting attention as a form of human flow statistics. One is that it uses base station location information from SoftBank, the service provider. While the data is anonymized and statistically processed to prevent personal identification, it nonetheless collects location information from tens of millions of mobile devices. The other is that it incorporates PACIFIC CONSULTANTS' expertise in location information analysis. This matching allows for highly accurate estimation of not only where people traveled from and to, but also the routes and means of transportation used for those trips, covering the movements of approximately 120 million people nationwide. Naturally, the data can be organized by day, weekdays/holidays, and weather, or broken down further into categories such as gender, age, place of residence, and time of day, allowing for further utilization according to your needs.
<Changes in stay times and new migration routes were observed>
By dynamically capturing with high resolution not just "how many people are there and where" but "who moved and when," it becomes clear who is where and what kind of services they are expecting.
For example, a theme park popular with young women opened near a regional city. Nearby was a shrine that was already popular with women as a power spot, as well as one of the country's leading aquariums. A typical analysis would involve comparing the "numbers" of visitors to the new theme park and examining how the number of visitors to the shrine and aquarium changed as a result. This resulted in discussions and considerations focused solely on the numbers, with some thinking that the target facility was a rival, or that they should come up with new events to attract more visitors. However, when the actual number of visitors was examined, the shrine's visitor numbers only decreased by 2%, while the aquarium's numbers actually increased by 15%.
Using big data on human flow, we found that this was actually due to the influence of excursions from the new theme park. By analyzing this kind of "quality," we can consider measures to encourage greater collaboration between facilities in the area, thereby turning the target facilities into allies. We also found that the biggest change was the length of stay. At the new theme park, about 40% of women stayed for more than three hours, and as a result, the number of women staying for less than one hour at the aquarium increased by about 30%. This means that it is difficult to increase visitor satisfaction with large-scale shows held every three hours. Instead, planning small-scale events held every hour may increase satisfaction and lead to more repeat visitors.
<It is now possible to provide unique services while avoiding congestion>
The human flow statistical data can also shed new light on the dynamics of visitors to large events. For example, the Sumida River Fireworks Festival in Tokyo is a major event that attracts a million visitors. Everyone imagines that the surrounding stations will all be crowded and difficult to access. Therefore, we looked at hourly changes in people flow at the five nearest stations and two stations a little further away. We found that the five stations closest to the venue were indeed used by seven times as many people as on a normal day during the fireworks display. However, at nearby Ueno Station, despite being only about 2 km away, the maximum increase was only about 170%, and there was almost no congestion.
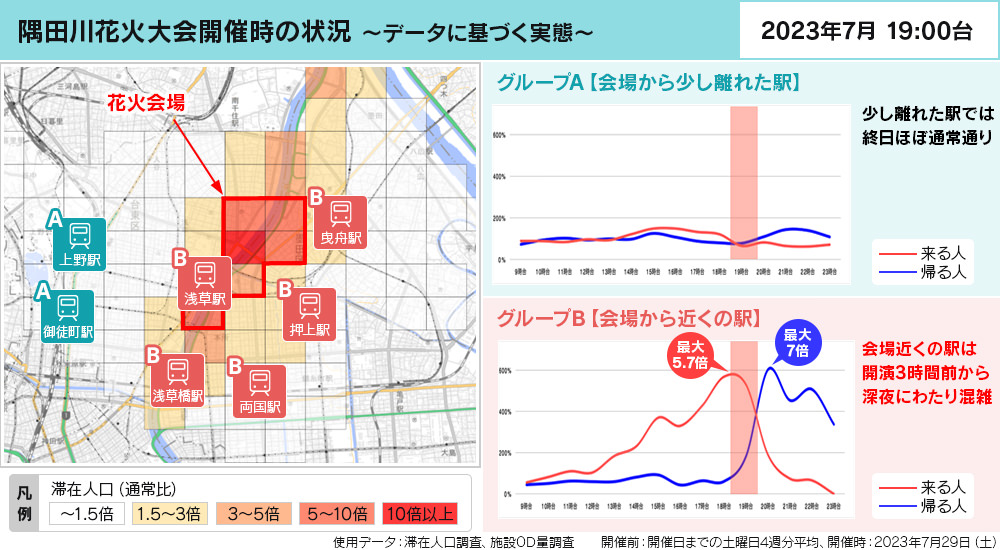
*Our own analysis based on nation-wide movement statistics
In a typical business plan, you look for the place where the most people gather and then compete for a piece of the pie there. However, if you dare to move a little away from that and offer a unique service menu on the day of the fireworks display, you can attract people who want to avoid the huge crowds around the station. This will help to disperse the crowds, which is also a plus for the local area.
By observing the flow of people, new approaches can be discovered, and the information can also be used by event organizers to plan traffic congestion countermeasures and traffic restrictions. Understanding the "customer journey" by attribute, i.e., who moves and how, can lead to new business opportunities.
<Verifying how evacuation orders were implemented during disasters>
human flow data can be used not only for events but also for disaster prevention. For example, it is possible to look back on each area to see how quickly and by what route residents evacuated in response to evacuation orders, or how many people returned home at night despite evacuation orders still in place, and when this began. human flow data also makes it possible to consider what measures are needed to ensure thorough evacuation of residents.
What PACIFIC CONSULTANTS can do
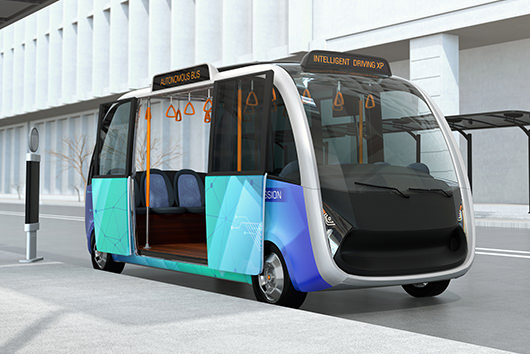
Traditional trade area analysis and understanding of regional characteristics have been limited to pinpointing static data such as "how many people are in a specific location." However, by utilizing the "Nation-wide Movement Statistics," we can understand from various perspectives, for 120 million people nationwide, "where people departed from, what transit points they used, and what area they ultimately arrived at," as well as "what means of transportation they used and what route they took." The possibilities for utilizing this new data are virtually endless. We will work with many people to utilize this unprecedented big data on people flow in urban planning and development, disaster prevention measures, restaurant opening plans, tourist destination revitalization, and support the introduction of new mobility services such as self-driving buses, thereby contributing to solving social issues and revitalizing industry.